True or False : Bins can be created on dimensions
Correct Answer:
B
Bin are a user-defined grouping of numerical data in the data source.
According to the official Tableau documentation: It's sometimes useful to convert a continuous measure (or a numeric dimension) into bins.
Have a look at the following image. When we right click a measure, we get the following options: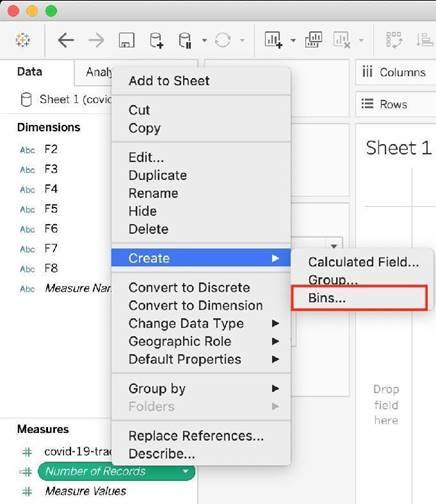
However, for a dimension (this is because the DATA TYPE of this dimension is a string: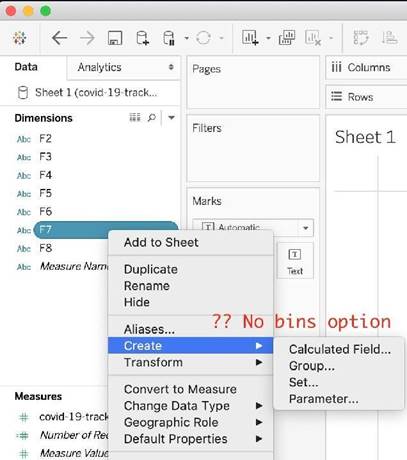
But what if we have a dimension of type NUMBER (NUMERIC DIMENSION)? See below: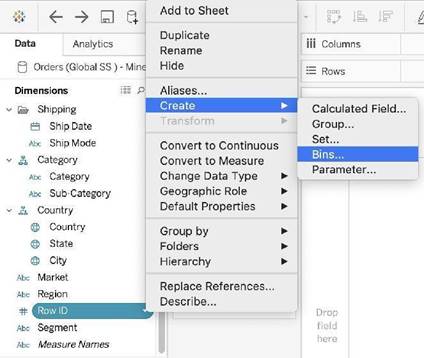
We can clearly create bins from dimensions too - they just have to be numeric :)
For more information, please refer to : https://help.tableau.com/current/pro/desktop/en- us/calculations_bins.htm
We can join a maximum of _____ tables in Tableau
Correct Answer:
B
It is possible to join a maximum of 32 tables in Tableau!
Reference: https://www.mytectra.com/interview-question/tableau-interview-question-and- answers
How can you MANUALLY assign geographic roles to a dimension from the data pane?
Correct Answer:
B
From the data pane, simply right click on the dimension, choose geographic role, and then select the appropriate role as follows: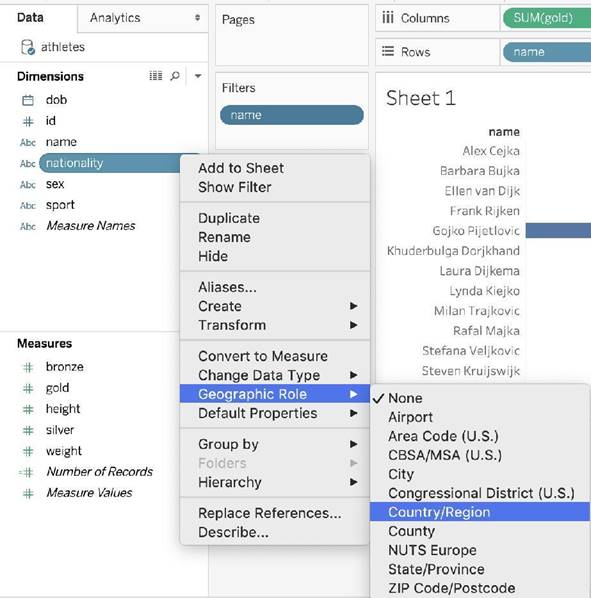
What is the one critical difference between normal calculated fields, and the calculated fields created after Data blending?
Correct Answer:
B
Yes, due to the nature of blends, there are some conditions as follows from the official documentation that must be kept in mind while working with blends: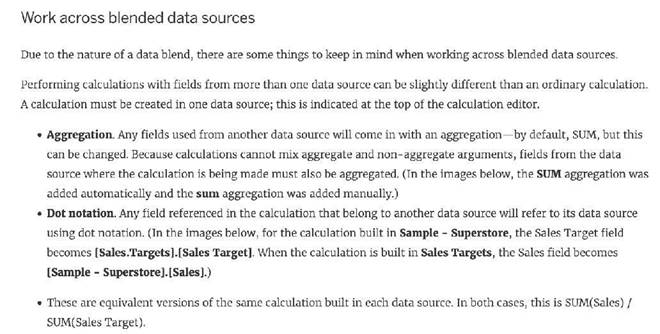
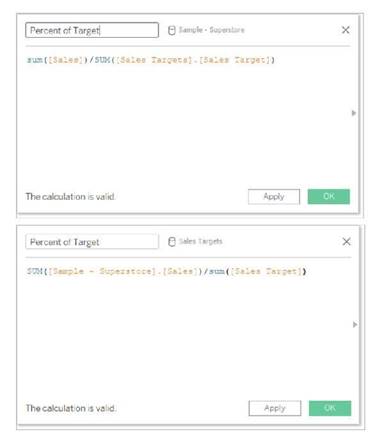
In addition to handling calculations slightly differently, there are some limitations on secondary data sources. You may not be able to sort by a field from a secondary data source, and action filters may not work as expected with blended data. For more information, see Other data blending issues.
Reference: https://help.tableau.com/current/pro/desktop/en-us/multiple_connections.htm
Which two analytics options are available for a scatter plot view? Choose two.
Correct Answer:
CD
For a scatter plot view in Tableau, you can add reference lines and trend lines as part of the analytics options. Reference lines can be added to a visualization to mark certain values or to provide context, such as an average line across a scatter plot. Trend lines, on the other hand, are used to show the relationship between two variables in the view, indicating the general direction or pattern of the data points in a scatter plot.
