- (Topic 4)
You have a report that contains a donut chart and a clustered column chart. Interactions between the visuals use the default settings.
You need to modify the report so that when you select a column m the column chart, the
donut chart redraws by using the data from the selected column. What should you do?
Correct Answer:
B
FILL IN THE BLANK - (Topic 4)
You are creating a line chart in a Power Bl report as shown in the following exhibit.
Use the drop-down menus to select the answer choice that completes each statement based on the information presented in the graphic.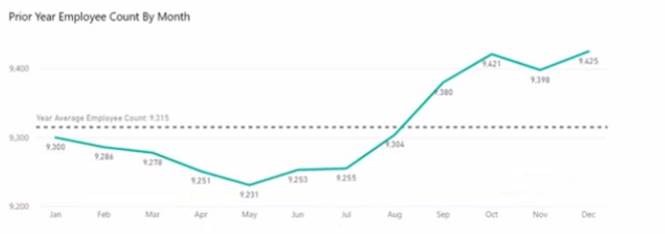
NOTE: Each correct selection is worth one point.
Solution:
Answer as selected
Does this meet the goal?
Correct Answer:
A
- (Topic 1)
What should you create to meet the reporting requirements of the sales department?
Correct Answer:
C
The sale department requires reports that contain the number of sales transactions.
The COUNTROWS function counts the number of rows in the specified table, or in a table defined by an expression.
Reference:
https://docs.microsoft.com/en-us/dax/countrows-function-dax
HOTSPOT - (Topic 4)
Correct Answer:
A HOTSPOT - (Topic 4)
Correct Answer:
A
You have a Power BI report.
You need to create a calculated table to return the 100 highest spending customers.
How should you complete the DAX expression? To answer, select the appropriate options in the answer area.
NOTE: Each correct selection is worth one point.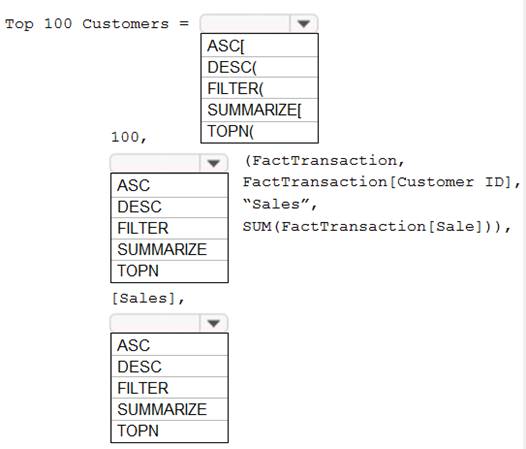
Solution:
Box 1: TOPN
TOPN returns the top N rows of the specified table.
Box 2: SUMMARIZE
SUMMARIZE returns a summary table for the requested totals over a set of groups.
Box 3: DESC
Sort in descending order.
It is last in the TOPN command. TOPN syntax:
TOPN(,
Does this meet the goal?
You need to create a Power BI report. The first page of the report must contain the following two views:
*Sales By Postal Code
*Sales by Month
Both views must display a slicer to select a value for a field named Chain.
The Sales By Postal Code view must display a map visual as shown in the following exhibit.
The Sales By Month view must display a column chart visual as shown in the following exhibit.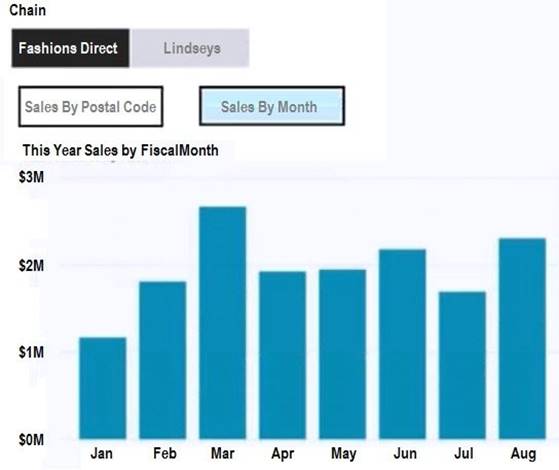
Users must be able to switch between the views by using buttons on the report page. The selected Chain field must be maintained when switching between views.
What is the minimum number of bookmarks required, and which property should you apply to each bookmark? To answer, select the appropriate options in the answer area.
NOTE: Each correct selection is worth one point.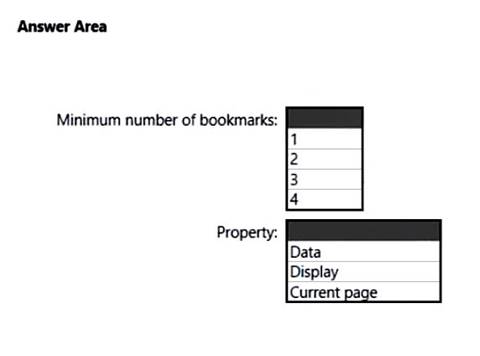
Solution:
Box 1: 2
Box 2: Display
Does this meet the goal?
