- (Topic 4)
In Power BI Desktop, you are creating a report that will contain three pages. You need to create a custom tooltip page and prepare the page for use.
Which three actions should you perform? Each correct answer presents part of the
solution.
Correct Answer:
BCD
You can create a custom tooltip page that shows more details about the selected category, such as this:
To create a custom tooltip page and prepare it for use, you need to perform these three actions34:
✑ Add and configure visuals on the tooltip page. You can add any visuals, images, or
other items that you want to show on the tooltip page. You can also format them as you like.
✑ For the tooltip page, set Allow use as tooltip to On. This will enable Power BI to
recognize this page as a tooltip page. You can also change the Page size to Tooltip to fit your content better.
✑ For the target visual, set Tooltip type to Report page. This will allow you to select
which report page you want to use as a custom tooltip for your visual. You can also filter your tooltip by fields from your target visual.
- (Topic 4)
You have a Power Bi model mat contains a table named Date. The Date table contains the fallowing columns:
• Date
• Fiscal year
• Fiscal Quartet
• Month Name
• Calendar Year
• Week Number
• Month Number
• Calendar Quarter
You need to create a calculated table based on the Date table. The calculated tab*e must contain only unique combinations of values for Calendar Year. Calendar Quarter and Calendar Month. Which DAX function should you include in the table deflation?
Correct Answer:
C
HOTSPOT - (Topic 4)
You have a Power BI model that has the following tables:
✑ Product (Product_id, Product_Name)
✑ Sales (Order_id, Order_Date, Product_id, Salesperson_id, Sales_Amount)
✑ Salesperson (Salesperson_id, Salesperson_name, address)
You plan to create the following measure.
Measure1 = DISTINCTCOUNT(Sales[ProductID]) You need to create the following relationships:
✑ Sales to Product
✑ Sales to Salesperson
The solution must ensure that you can use Measure1 to display the count of products sold by each salesperson.
How should you configure the relationships? To answer, select the appropriate options in the answer area.
NOTE: Each correct selection is worth one point.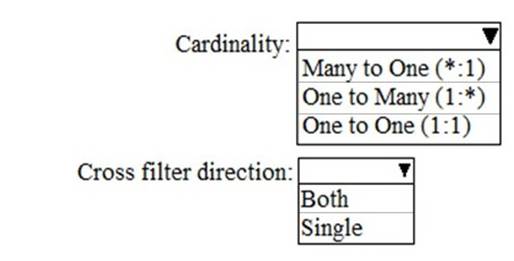
Solution: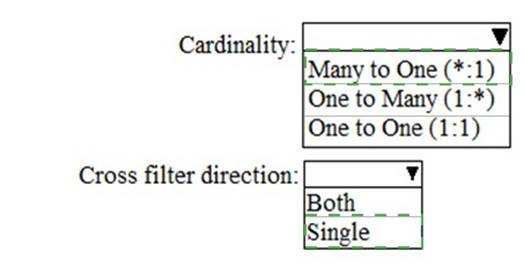
Does this meet the goal?
Correct Answer:
A
FILL IN THE BLANK - (Topic 4)
You need to create a relationship in the dataset for RLS.
What should you do? To answer select the appropriate options in the answer area. NOTE: Each correct selection is worth one point.
Solution: Answer as below
Does this meet the goal?
Correct Answer:
A
- (Topic 4)
You have a Power Bl workspace named Inventory that contains a dataset a report and a dashboard.
You need to add an additional tile to the dashboard. The tile must show inventory by location. This information is NOT visualized in the report. The solution must minimize the impact on the report.
Which two actions should you perform? Each correct answer presents part of the solution. NOTE: Each correct selection is worth one point.
Correct Answer:
CE
