HOTSPOT - (Topic 3)
Correct Answer:
A FILL IN THE BLANK - (Topic 4)
Correct Answer:
A FILL IN THE BLANK - (Topic 4)
Correct Answer:
A - (Topic 4)
Correct Answer:
D - (Topic 4)
Correct Answer:
C
You need to create a measure that will return the percentage of late orders.
How should you complete the DAX expression? To answer, select the appropriate options in the answer area.
NOTE: Each correct selection is worth one point.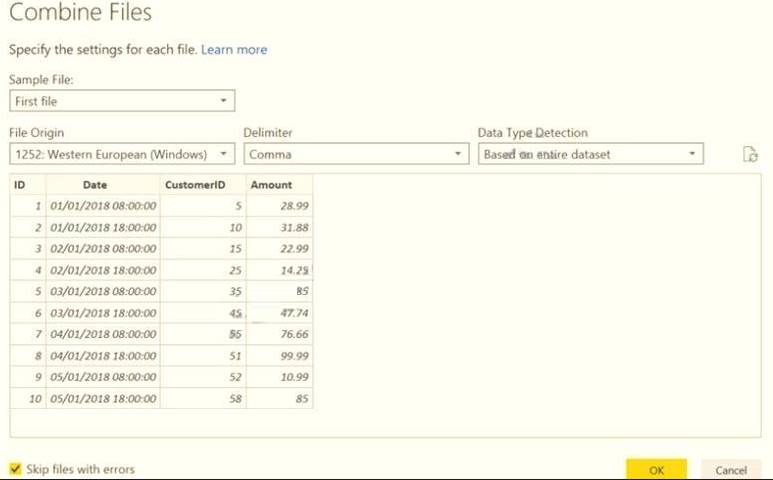
Solution:
Box 1: CALCULATE
CALCULATE evaluates an expression in a modified filter context.
Syntax: CALCULATE(
filter1, filter2,… (Optional) Boolean expressions or table expressions that defines filters, or filter modifier functions.
Box 2: FILTER
FILTER returns a table that represents a subset of another table or expression. Syntax: FILTER(,
Table- The table to be filtered. The table can also be an expression that results in a table. Filter - A Boolean expression that is to be evaluated for each row of the table. For example, [Amount] > 0 or [Region] = "France"
Box 3: Orders[ShippedDate]> Orders[RequiredDate]
Northwind Traders defines late orders as those shipped after the required shipping date.
Does this meet the goal?
The table has the following columns.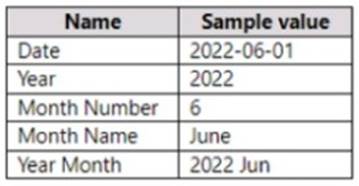
You need to add a column that will be used to sort the Year Month column chronologically.
Solution:
Answer as.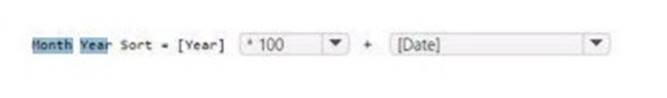
Does this meet the goal?
You have a Power 31 data model that contains a table named Stores. The table has the following columns:
* Store Name
* Open Date
* Status
* State
* City
You need to create a calculated column named Active Store Name that meets the following requirements:
Solution:
Answer is as below
Does this meet the goal?
Note: This question is a part of a series of questions that present the same scenario. For your convenience, the scenario is repeated in each question. Each question presents a different goal and answer choices, but the text of the scenario is exactly the same in each question in this series.
Start of repeated scenario
You have a Microsoft SQL Server database that has the tables shown in the Database Diagram exhibit. (Click the Exhibit.)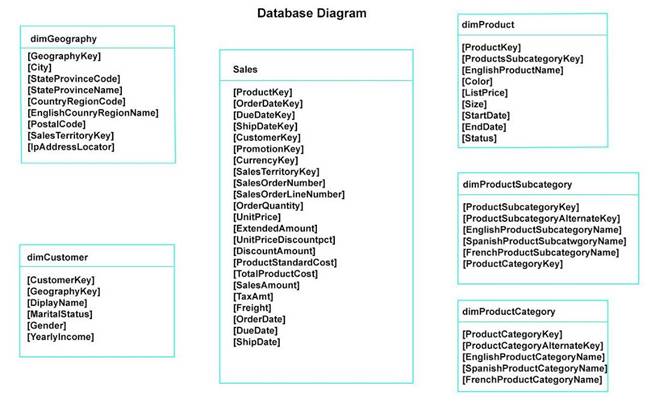
You plan to develop a Power BI model as shown in the Power BI Model exhibit. (Click the Exhibit).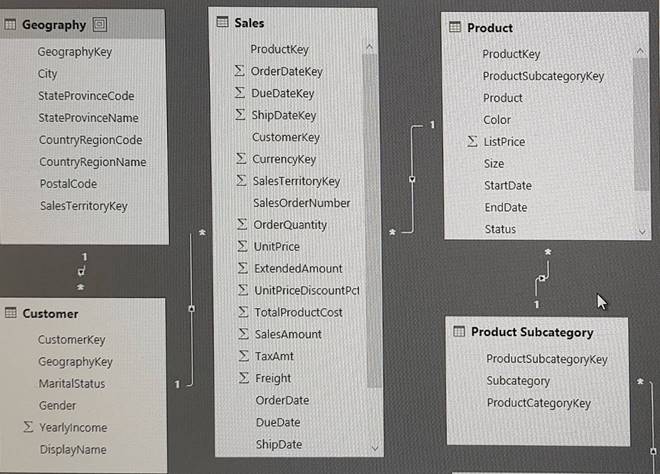
You plan to use Power BI to import data from 2013 to 2015. Product Subcategory [Subcategory] contains NULL values.
End of repeated scenario.
You implement the Power BI model.
You need to add a new column to the Product Subcategory table that uses the following formula.
=if [Subcategory] =null then “NA” else [Subcategory] Which command should you use in Query Editor?
References: http://community.powerbi.com/t5/Desktop/if-then-else/td-p/117999
You have the visual shown in the Original exhibit. {Click the Original tab.)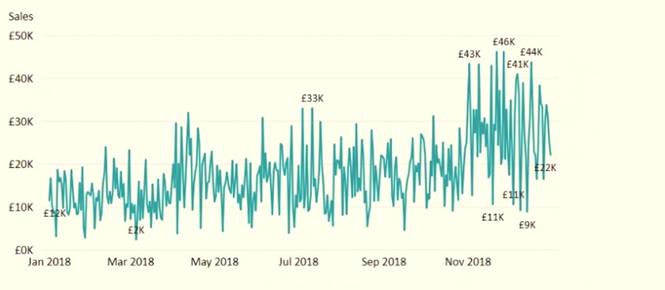
You need to configure the visual as shown in the Modified exhibit. (Click the Modified tab.)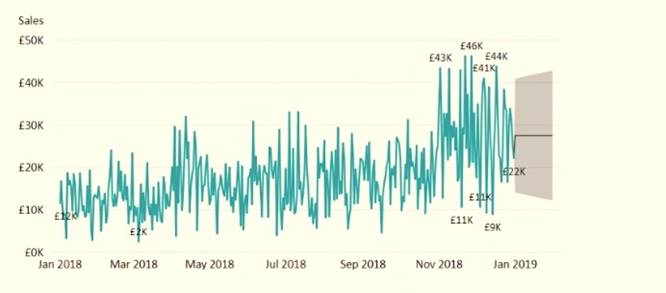
What should you add to the visual?
Explore forecast results by adjusting the desired confidence interval or by adjusting outlier data to see how they affect results.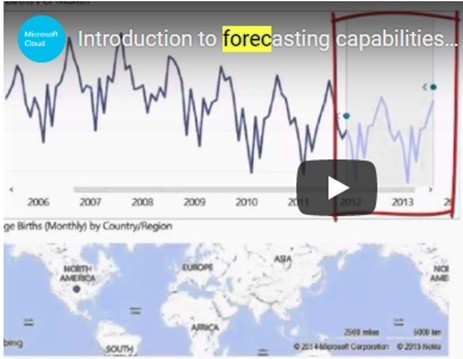
Timeline Description automatically generated with low confidence
Reference:
https://powerbi.microsoft.com/fr-fr/blog/introducing-new-forecasting-capabilities-in-power-view-for-office-365/
