DRAG DROP - (Topic 4)
In Power Query Editor, you have three queries named ProductCategory, ProductSubCategory, and Product.
Every Product has a ProductSubCategory.
Not every ProductsubCategory has a parent ProductCategory.
You need to merge the three queries into a single query. The solution must ensure the best performance in Power Query.
How should you merge the tables? To answer, drag the appropriate merge types to the correct queries. Each merge type may be used once, more than once, or not at all. You may need to drag the split bar between panes or scroll to view content.
NOTE: Each correct selection is worth one point.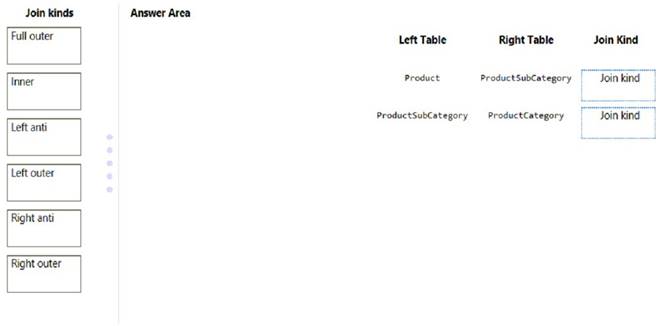
Solution: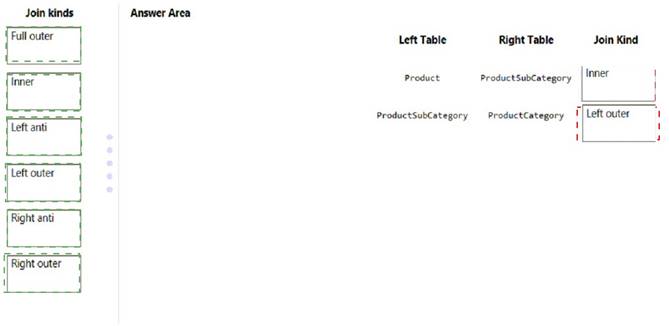
Does this meet the goal?
Correct Answer:
A
- (Topic 4)
You have the following three versions of an Azure SQL database:
✑ Test
✑ Production
✑ Development
You have a dataset that uses the development database as a data source.
You need to configure the dataset so that you can easily change the data source between the development, test, and production database servers from powerbi.com.
Which should you do?
Correct Answer:
B
https://docs.microsoft.com/en-us/learn/modules/create-manage-workspaces-power-bi/4-development-lifecycle-strategy
- (Topic 4)
You import two Microsoft Excel tables named Customer and Address into Power Query. Customer contains the following columns:
✑ Customer ID
✑ Customer Name
✑ Phone
✑ Email Address
✑ Address ID
Address contains the following columns:
✑ Address ID
✑ Address Line 1
✑ Address Line 2
✑ City
✑ State/Region
✑ Country
✑ Postal Code
The Customer ID and Address ID columns represent unique rows.
You need to create a query that has one row per customer. Each row must contain City, State/Region, and Country for each customer.
What should you do?
Correct Answer:
A
There are two primary ways of combining queries: merging and appending.
✑ When you have one or more columns that you’d like to add to another query, you merge the queries.
✑ When you have additional rows of data that you’d like to add to an existing query, you append the query.
Reference:
https://docs.microsoft.com/en-us/power-bi/connect-data/desktop-shape-and-combine-data
- (Topic 4)
You are using the key influencers visual to identify which factors affect the quantity of items sold in an order.
You add the following fields to the Explain By field:
* Customer Country
* Product Category
* Supplier Country
* Sales Employee
* Supplier Name
* Product Name
* Customer City
The key influencers visual returns the results shown in the following exhibit.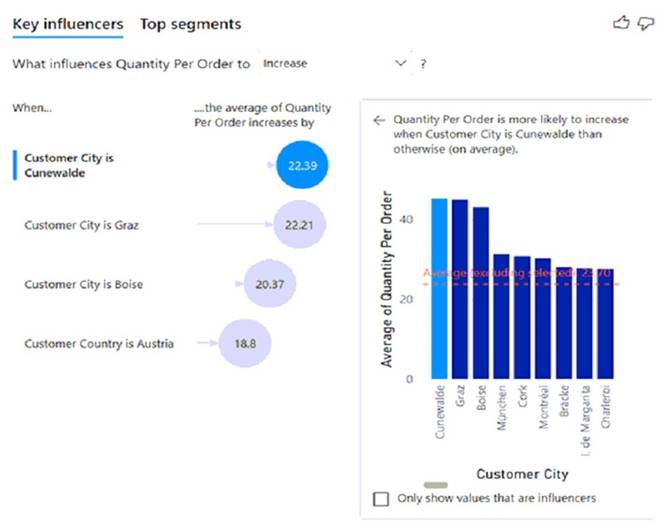
What can you identify from the visual?
Correct Answer:
A
HOTSPOT - (Topic 2)
You need to calculate the last day of the month in the balance sheet data to ensure that you can relate the balance sheet data to the Date table. Which type of calculation and which formula should you use? To answer, select the appropriate options in the answer area. NOTE: Each correct selection is worth one point.
Solution:
Box 1: A DAX Calculated measure
Box 2: Date.EndofQuarter(#date([Year],[Mont],1))
ENDOFQUARTER returns the last date of the quarter in the current context for the specified column of dates.
The following sample formula creates a measure that returns the end of the quarter, for the current context.
= ENDOFQUARTER(DateTime[DateKey])
Does this meet the goal?
Correct Answer:
A
