- (Exam Topic 5)
You need to migrate an on-premises Microsoft SQL Server database to Azure SQL Database. The solution must minimize downtime.
What should you do?
Correct Answer:
C
Reference:
https://docs.microsoft.com/en-us/azure/azure-sql/database/migrate-to-database-from-sql-server#method-1-migra
- (Exam Topic 5)
You are monitoring an Azure Stream Analytics job.
You discover that the Backlogged input Events metric is increasing slowly and is consistently non-zero. You need to ensure that the job can handle all the events.
What should you do?
Correct Answer:
D
Backlogged Input Events: Number of input events that are backlogged. A non-zero value for this metric implies that your job isn't able to keep up with the number of incoming events. If this value is slowly increasing or consistently non-zero, you should scale out your job, by increasing the SUs.
Reference:
https://docs.microsoft.com/en-us/azure/stream-analytics/stream-analytics-monitoring
- (Exam Topic 5)
You have an Azure SQL database.
Users report that the executions of a stored procedure are slower than usual. You suspect that a regressed query is causing the performance issue.
You need to view the query execution plan to verify whether a regressed query is causing the issue. The solution must minimize effort.
What should you use?
Correct Answer:
C
Use the Query Store Page in SQL Server Management Studio.
Query performance regressions caused by execution plan changes can be non-trivial and time consuming to resolve.
Since the Query Store retains multiple execution plans per query, it can enforce policies to direct the Query Processor to use a specific execution plan for a query. This is referred to as plan forcing. Plan forcing in Query Store is provided by using a mechanism similar to the USE PLAN query hint, but it does not require any change in user applications. Plan forcing can resolve a query performance regression caused by a plan change in a very short period of time.
Reference:
https://docs.microsoft.com/en-us/sql/relational-databases/performance/monitoring-performance-by-using-the-qu
- (Exam Topic 5)
A company plans to use Apache Spark analytics to analyze intrusion detection data.
You need to recommend a solution to analyze network and system activity data for malicious activities and policy violations. The solution must minimize administrative efforts.
What should you recommend?
Correct Answer:
C
Azure HDInsight offers pre-made, monitoring dashboards in the form of solutions that can be used to monitor the workloads running on your clusters. There are solutions for Apache Spark, Hadoop, Apache Kafka, live long and process (LLAP), Apache HBase, and Apache Storm available in the Azure Marketplace.
Note: With Azure HDInsight you can set up Azure Monitor alerts that will trigger when the value of a metric or the results of a query meet certain conditions. You can condition on a query returning a record with a value that is greater than or less than a certain threshold, or even on the number of results returned by a query. For example, you could create an alert to send an email if a Spark job fails or if a Kafka disk usage becomes over 90 percent full.
Reference:
https://azure.microsoft.com/en-us/blog/monitoring-on-azure-hdinsight-part-4-workload-metrics-and-logs/
- (Exam Topic 5)
You have an Azure data factory that has two pipelines named PipelineA and PipelineB. PipelineA has four activities as shown in the following exhibit.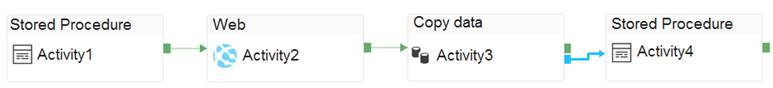
PipelineB has two activities as shown in the following exhibit.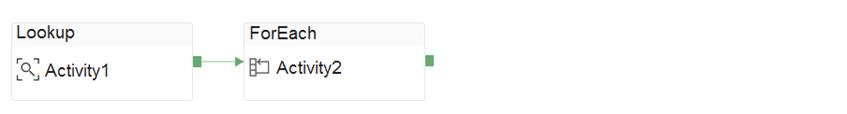
You create an alert for the data factory that uses Failed pipeline runs metrics for both pipelines and all failure types. The metric has the following settings: Operator: Greater than Aggregation type: Total Threshold value: 2 Aggregation granularity (Period): 5 minutes Frequency of evaluation: Every 5 minutes
Data Factory monitoring records the failures shown in the following table.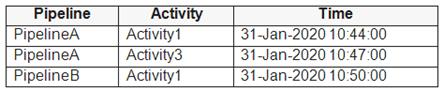
For each of the following statements, select Yes if the statement is true. Otherwise, select No.
NOTE:Each correct selection is worth one point.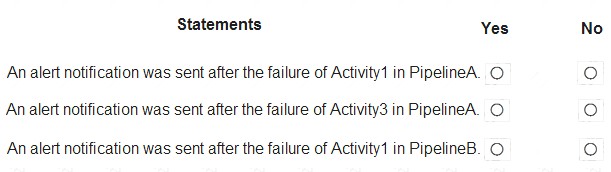
Solution:
Text Description automatically generated
Box 1: No
Just one failure within the 5-minute interval. Box 2: No
Just two failures within the 5-minute interval. Box 3: No
Just two failures within the 5-minute interval. Reference:
https://docs.microsoft.com/en-us/azure/azure-monitor/alerts/alerts-metric-overview
Does this meet the goal?
Correct Answer:
A
