Which of the following best describes a business analytics tool with interactive visualization and business capabilities and an interface that is simple enough for end users to create their own reports and dashboards?
Correct Answer:
C
The best answer is C. Microsoft Power BI.
Microsoft Power BI is a business analytics and business intelligence service by Microsoft. It aims to provide interactive visualizations and business intelligence capabilities with an interface simple enough for end users to create their own reports and dashboards. Power BI can connect to multiple data sources, clean and transform data, create custom calculations, and visualize data through charts, graphs, and tables. Power BI can be accessed through a web browser, mobile device, or desktop application and integrated with other Microsoft tools like Excel and SharePoint12
Python is not correct, because Python is a general-purpose programming language that can be used for various applications, including data analysis and visualization. However, Python is not a dedicated business analytics tool, and it requires coding or programming skills to create reports and dashboards.
R is not correct, because R is a programming language and software environment for statistical computing and graphics. R can be used for data analysis and visualization, but it is not a specialized business analytics tool, and it requires coding or programming skills to create reports and dashboards.
SAS is not correct, because SAS is a software suite for advanced analytics, business intelligence, data management, and predictive analytics. SAS can provide interactive visualizations and business capabilities, but it does not have an interface that is simple enough for end users to create their own reports and dashboards. SAS also requires coding or programming skills to use its features.
You are working with a dataset and want to change the names of categories that you used for different types of books.
What term best describes this action?
Correct Answer:
A
The term that best describes the action of changing the names of categories that you used for different types of books is recoding. Recoding is a process of transforming or modifying the values of a variable or a category to make them more meaningful, consistent, or accurate. For example, you can recode the names of book genres from ??Fiction??, ??Non-Fiction??, ??Biography??, etc. to ??FIC??, ??NF??, ??BIO??, etc. to make them shorter and easier to use. Reference: Recoding Data - SPSS Tutorials - LibGuides at
Kent State University
An analyst is currently working on a ticket for revamping a company-wide dashboard that has been in use for five years. Which of the following should be the first step in the development process?
Correct Answer:
A
The first step in the development process of revamping a company-wide dashboard should be to talk to the group that made the request to determine the desired goal. This would help to understand the needs, expectations, and preferences of the stakeholders, as well as the scope, purpose, and objectives of the project. Talking to the group that made the request would also help to establish a clear communication channel, build rapport and trust, and solicit feedback and suggestions.
A data analyst has been asked to merge the tables below, first performing an INNER JOIN and then a LEFT JOIN: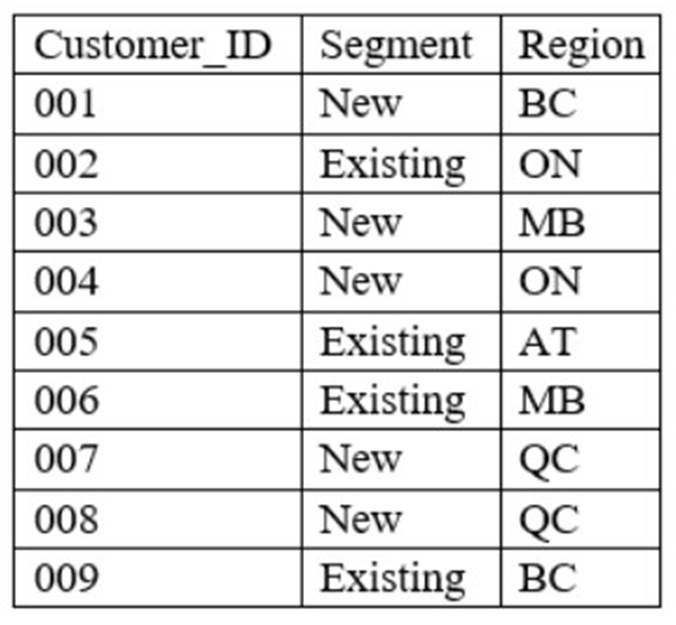
Customer Table -
In-store Transactions –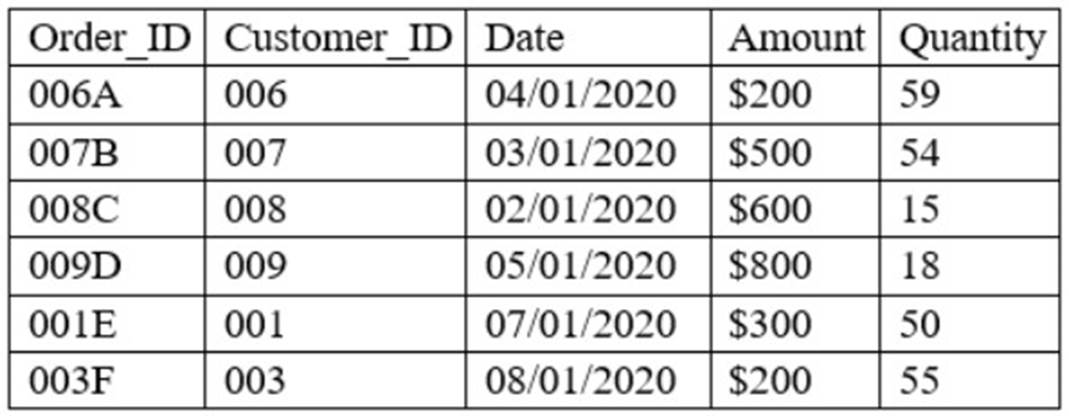
Which of the following describes the number of rows of data that can be expected after performing both joins in the order stated, considering the customer table as the main table?
Correct Answer:
C
An INNER JOIN returns only the rows that match the join condition in both tables. A LEFT JOIN returns all the rows from the left table, and the matched rows from the right table, or NULL if there is no match. In this case, the customer table is the left table and the in-store transactions table is the right table. The join condition is based on the customer_id column, which is common in both tables.
To perform an INNER JOIN, we can use the following SQL query:
SELECT * FROM customer INNER JOIN in_store_transactions ON customer.customer_id
= in_store_transactions.customer_id;
This query will return 9 rows of data, as shown below:
customer_id | name | lastname | gender | marital_status | transaction_id | amount | date 1 | MARC | TESCO | M | Y | 1 | 1000 | 2020-01-01 1 | MARC | TESCO | M | Y | 2 | 5000 | 2020-01-02 2 | ANNA | MARTIN | F | N | 3 | 2000 | 2020-01-03 2 | ANNA | MARTIN | F | N |
4 | 3000 | 2020-01-04 3 | EMMA | JOHNSON | F | Y | 5 | 4000 | 2020-01-05 4 | DARIO | PENTAL | M | N | 6 | 5000 | 2020-01-06 5 | ELENA | SIMSON| F| N|7|6000|2020-01-07 6|TIM|ROBITH|M|N|8|7000|2020-01-08 7|MILA|MORRIS|F|N|9|8000|2020-01-09
To perform a LEFT JOIN, we can use the following SQL query:
SELECT * FROM customer LEFT JOIN in_store_transactions ON customer.customer_id = in_store_transactions.customer_id;
This query will return 15 rows of data, as shown below: customer_id|name|lastname|gender|marital_status|transaction_id|amount|date 1|MARC|TESCO|M|Y|1|1000|2020-01-01 1|MARC|TESCO|M|Y|2|5000|2020-01-02
2|ANNA|MARTIN|F|N|3|2000|2020-01-03 2|ANNA|MARTIN|F|N|4|3000|2020-01-04
3|EMMA|JOHNSON|F|Y|5|4000|2020-01-05 4|DARIO|PENTAL|M|N|6|5000|2020-01-06
5|ELENA|SIMSON||F||N||7||6000||2020-01-07 6||TIM||ROBITH||M||N||8||7000||2020-01-08
7||MILA||MORRIS||F||N||9||8000||2020-01-09
8||JENNY||DWARTH||F||Y||NULL||NULL||NULL
As you can see, the customers who do not have any transactions (customer_id = 8) are still included in the result, but with NULL values for the transaction_id, amount, and date columns.
Therefore, the correct answer is C: INNER: 9 rows; LEFT: 15 rows. Reference: SQL Joins - W3Schools
A data analyst has a set of data that shows the number of gallons of oil produced each day. The company would like to know the standard deviation for the data set. The variance for the data is 36 gallons. Which of the following is the standard deviation for gallons
produced?
Correct Answer:
B
The standard deviation is a measure of the amount of variation or dispersion in a set of values. It is calculated as the square root of the variance. Given that the variance for the data set is 36 gallons, the standard deviation can be found by taking the square root of 36, which is 6. Therefore, the standard deviation for the number of gallons of oil produced each day is 6 gallons.
References:
✑ The concept of standard deviation and its calculation is a fundamental aspect of statistics, which is well-documented in statistical textbooks and resources.
✑ The calculation performed to arrive at the answer is based on the mathematical operation of taking the square root of the variance value.
