An analyst modified a data set that had a number of issues. Given the original and modified versions: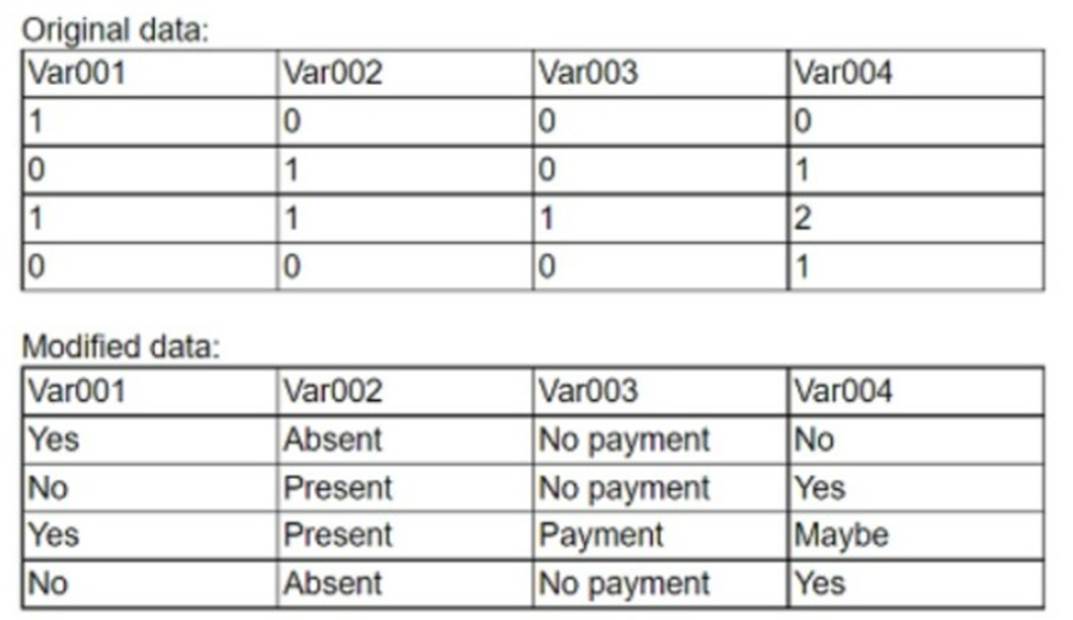
Which of the following data manipulation techniques did the analyst use?
Correct Answer:
B
The correct answer is B. Recoding.
Recoding is a data manipulation technique that involves changing the values or categories of a variable to make it more suitable for analysis. Recoding can be used to simplify or group the data, to correct errors or inconsistencies, or to create new variables from existing ones12
In the example, the analyst used recoding to change the values of Var001, Var002, Var003, and Var004 from numerical to textual form. The analyst also used recoding to assign meaningful labels to the values, such as ??Absent?? for 0, ??Present?? for 1, ??Low?? for 2, ??Medium?? for 3, and ??High?? for 4. This makes the data more understandable and easier to analyze.
A reporting analyst is creating a dashboard that shows the year-over-year performance for a sales organization. Which of the following is the best visual for the analyst use to illustrate the organization's performance?
Correct Answer:
D
Which of the following is an object associated with a table that sorts and stores table row data in a key-value pair?
Correct Answer:
D
A web developer wants to ensure that malicious users can't type SQL statements when they asked for input, like their username/userid.
Which of the following query optimization techniques would effectively prevent SQL Injection attacks?
Correct Answer:
D
The correct answer is D: Parametrization. Parameterized SQL queries allow you to place parameters in an SQL query instead of a constant value. A parameter takes a value only when the query is executed, allowing the query to be reused with different values and
purposes. Parameterized SQL statements are available in some analysis clients, and are also available through the Historian SDK.
For example, you could create the following conditional SQL query, which contains a parameter for the collector's name: SELECT* FROM ExamsDigest WHERE coursename=? ORDER BY tagname SQL Injection is best prevented through the use of parameterized queries.
A research analyst wants to determine whether the data being analyzed is connected to other datapoints. Which of the following is the BEST type of analysis to conduct?
Correct Answer:
C
This is because link analysis is a type of analysis that determines whether the data being analyzed is connected to other datapoints, such as entities, events, or relationships. Link analysis can be used to identify and visualize the patterns, networks, or associations among the datapoints, as well as measure the strength, direction, or frequency of the connections. For example, link analysis can be used to determine if there is a connection between a customer??s purchase history and their loyalty program status. The other types of analysis are not the best types of analysis to conduct to determine whether the data being analyzed is connected to other datapoints. Here is why:
✑ Trend analysis is a type of analysis that determines whether the data being analyzed is changing over time, such as increasing, decreasing, or fluctuating. Trend analysis can be used to identify and visualize the patterns, cycles, or movements in the data points, as well as measure the rate, direction, or magnitude of the changes. For example, trend analysis can be used to determine if there is a change in a company??s sales revenue over a period of time.
✑ Performance analysis is a type of analysis that determines whether the data being
analyzed is meeting certain goals or objectives, such as targets, benchmarks, or standards. Performance analysis can be used to identify and visualize the gaps, deviations, or variations in the data points, as well as measure the efficiency, effectiveness, or quality of the outcomes. For example, performance analysis can be used to determine if there is a gap between a student??s test score and their expected score based on their previous performance.
✑ Exploratory analysis is a type of analysis that determines whether there are any insights or discoveries in the data being analyzed, such as patterns, relationships, or anomalies. Exploratory analysis can be used to identify and visualize the characteristics, features, or behaviors of the data points, as well as measure their distribution, frequency, or correlation. For example, exploratory analysis can be used to determine if there are any outliers or unusual values in a dataset.
