Which of the following is the best technique for transferring data from one database to another with some data manipulation?
Correct Answer:
C
An analyst is working on a project for a director. During this process. the analyst pulled the data. created summarized tables and graphs with descriptions, created a report summary, and inserted all items into a report. After writing the report, which of the following would be the most appropriate next step?
Correct Answer:
B
After writing the report, the most appropriate next step for the analyst is to complete a check for quality in the report. This involves reviewing the report for accuracy, clarity, completeness, consistency, and relevance. The analyst should ensure that the report addresses the director??s business questions and objectives, that the data and analysis are correct and reliable, that the tables and graphs are well-designed and easy to understand, that the descriptions and summary are concise and informative, and that there are no errors or inconsistencies in the report. A quality check will help the analyst to improve the presentation and communication of the report, as well as to avoid any misunderstandings or misinterpretations by the director1.
Which of the following is the correct data type for text?
Correct Answer:
B
A string is a data type that represents a sequence of characters, such as text, symbols, numbers, or punctuation marks. Strings are enclosed in quotation marks, such as ??Hello??, ??123??, or ??!@#??. Strings can be manipulated, concatenated, sliced, indexed, formatted, and searched using various methods and functions. A string is different from other data types, such as boolean, integer, or float, which represent logical values (true or false), whole numbers, or decimal numbers respectively. Therefore, the correct answer is B. References: What is a String? | Definition and Examples, Python String Methods
Given the following report: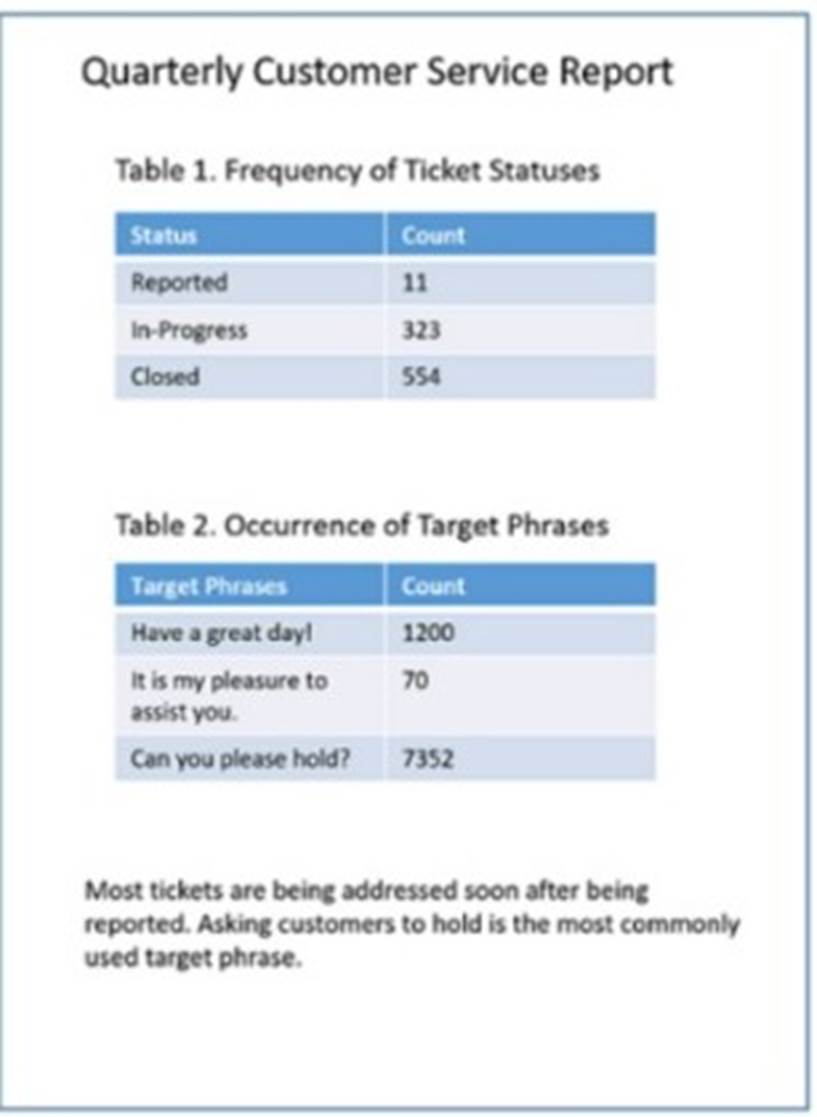
Which of the following components need to be added to ensure the report is point-in-time and static? (Select two).
Correct Answer:
DF
To ensure that a report is point-in-time and static, it should include the date when the report was last accessed and the date on which the report was run. These components confirm the specific time frame the data represents, making the report a fixed reference that does not change with subsequent data updates or accesses. This is crucial for accurate historical analysis and for maintaining the integrity of the data as it was at the time of the
report??s creation.
References:
✑ Best practices in business reporting.
✑ Importance of time-stamping in data analysis.
✑ Guidelines for creating static reports in data analytics.
The process of performing initial investigations on data to spot outliers, discover patterns, and test assumptions with statistical insight and graphical visualization is called:
Correct Answer:
C
This is because exploratory data analysis is a type of process that performs initial investigations on data to spot outliers, discover patterns, and test assumptions with statistical insight and graphical visualization, such as box plots, histograms, scatter plots, etc. Exploratory data analysis can be used to understand and summarize the data, as well as to generate hypotheses or questions for further analysis or research. For example, exploratory data analysis can be used to identify and visualize the characteristics, features, or behaviors of the data, as well as to measure their distribution, frequency, or correlation. The other options are not types of processes that perform initial investigations on data to spot outliers, discover patterns, and test assumptions with statistical insight and graphical visualization. Here is what they mean:
✑ A t-test is a type of statistical method that tests whether there is a significant difference between the means of two groups or samples, such as whether there is a difference between the average exam scores of two classes in this case. A t-test
can be used to test or verify a claim or an assumption about the data, as well as to measure the confidence or the error of the estimation.
✑ A performance analysis is a type of process that measures whether the data
meets certain goals or objectives, such as targets, benchmarks, or standards. A performance analysis can be used to identify and visualize the gaps, deviations, or variations in the data, as well as to measure the efficiency, effectiveness, or quality of the outcomes. For example, a performance analysis can be used to determine if there is a gap between a student??s test score and their expected score based on their previous performance.
✑ A link analysis is a type of process that determines whether the data is connected to other datapoints, such as entities, events, or relationships. A link analysis can be used to identify and visualize the patterns, networks, or associations among the datapoints, as well as to measure the strength, direction, or frequency of the connections. For example, a link analysis can be used to determine if there is a connection between a customer??s purchase history and their loyalty program status.
