Which of the following contains alphanumeric values?
Correct Answer:
D
Alphanumeric values are values that contain both letters and numbers, such as A3J7. The other options are numeric values, as they contain only numbers, such as 10.1E2, 13.6, and 1347. Reference: Guide to CompTIA Data+ and Practice Questions - Pass Your Cert
An analyst is designing a dashboard to determine which site has the highest percentage of new customers. The analyst must choose an appropriate chart to include in the dashboard. The following data is available: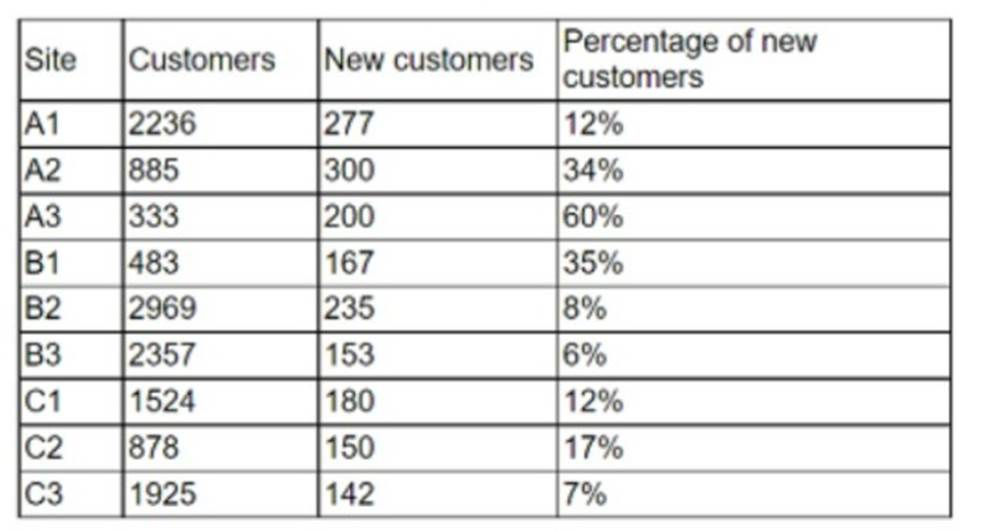
Which of the following types of charts should be considered to best display the data?
Correct Answer:
A
The best type of chart to display the data is A. Include a bar chart using the site and the percentage of new customers data.
A bar chart is a good choice for comparing categorical data with numerical data, such as the site and the percentage of new customers. A bar chart can show the relative differences between the sites and highlight the site with the highest percentage of new customers. A bar chart can also be easily labeled and formatted to make the data clear and understandable.
A line chart is not suitable for this data, because it is used to show trends or changes over time, which is not relevant for the site and the percentage of new customers data. A line chart would also be confusing and misleading, as it would imply a connection or correlation between the sites that does not exist.
A pie chart is also not a good choice for this data, because it is used to show the proportion of a whole, not the comparison of different categories. A pie chart would also be difficult to read and interpret, as it would require labels or legends to identify the sites and their percentages. A pie chart would also not be able to show the exact values of the percentages, only their relative sizes.
A scatter chart is another inappropriate option for this data, because it is used to show the relationship or correlation between two numerical variables, not between a categorical and a numerical variable. A scatter chart would also be cluttered and unclear, as it would plot each site as a point on a coordinate plane, without any labels or axes. A scatter chart would also not be able to show the differences or rankings between the sites and their percentages.
An analyst is reviewing the following data: Car IDSpeed
123155
566436
564418
650567
546436
645638
Which of the following should the analyst include in the measures of central tendency for speed?
Correct Answer:
D
The measures of central tendency include the mode, median, and mean. The mode is the value that appears most frequently in a data set. In this case, the speed of 36 appears twice, making it the mode. The median is the middle value when a data set is ordered from least to greatest; for these speeds, when ordered (18, 36, 36, 38, 55, 67), the median is the average of the two middle numbers, which is ( \frac{36 + 38}{2} = 37 ). The mean is the average of all values, calculated as ( \frac{55 + 36 + 18 + 67 + 36 + 38}{6} = 41.7 ). References:
✑ The calculation of the mode, median, and mean is based on standard statistical
formulas and definitions.
The measures of central tendency for speed include the mode, median, and mean. To calculate these, we first need to organize the data:
✑ Speeds in ascending order: 18, 36, 36, 38, 55, 67
✑ Mode is the value that appears most frequently, which is 36, as it appears twice.
✑ Median is the middle value when the data is ordered. Since we have an even number of observations, we take the average of the two middle values (36 and 38), resulting in 37.
✑ Mean is the sum of all values divided by the number of values. (18+36+36+38+55+67)/6=41.5(18+36+36+38+55+67)/6=41.5.
Thus, the correct option is D, which includes Mode = 36, Median = 37, and Mean = 41.5. The range, maximum, and minimum values, although useful in understanding data dispersion, are not measures of central tendency and are therefore not relevant to this specific question.
A user imports a data file into the accounts payable system each day. On a regular basis. the field input is not what the system is expecting. so it results in an error for the row and a broken import process. To resolve the issue, the user opens the file, finds the error in the row, and manually corrects it before attempting the import again. The import sometimes breaks on subsequent attempts. though. Which of the following changes should be made to this process to reduce the number of errors?
Correct Answer:
C
A data field to data type validator is a tool or a process that checks if the data in each field of a file matches the expected data type, such as text, number, date, etc. A data field to data type validator can help to identify and correct any errors or inconsistencies in the data before importing it into the accounts payable system. This would reduce the number of errors and broken imports, as well as save time and effort for the user.
An analyst is required to run a text analysis of data that is found in articles from a digital news outlet. Which of the following would be the BEST technique for the analyst to apply to acquire the data?
Correct Answer:
A
This is because web scraping is a technique that allows the analyst to extract data from web pages, such as articles from a digital news outlet. Web scraping can be done using various tools and methods, such as Python libraries, browser extensions, or online services. The other techniques are not suitable for acquiring data from web pages. Here is why:
Sampling is a technique that involves selecting a subset of data from a larger population, usually for statistical analysis or testing purposes. Sampling does not help the analyst to acquire data from web pages, but rather to reduce the amount of data to be analyzed. Data wrangling is a technique that involves transforming and cleaning data to make it suitable for analysis or visualization. Data wrangling does not help the analyst to acquire data from web pages, but rather to improve the quality and usability of the data.
ETL stands for Extract, Transform, and Load, which is a process that involves moving data from one or more sources to a destination, such as a data warehouse or a database. ETL does not help the analyst to acquire data from web pages, but rather to store and organize the data.
