Which of the following is the best description of the term "data governance"?
Correct Answer:
D
Data governance refers to the overarching management of data??s availability, usability, integrity, and security within an organization. It involves setting policies and standards that govern data usage, determining data ownership, implementing data security measures, and ensuring that data is accessible for business insights while maintaining its quality. The goal of data governance is to ensure that data is consistent, trustworthy, and not misused, supporting compliance with data privacy regulations and enabling effective data analytics to optimize operations and drive business decision-making.
References:
✑ Understanding Data Governance and Its Importance1.
✑ The Role of Data Governance in Data Management2.
✑ Defining Data Governance and Its Business Value3.
An e-commerce company recently tested a new website layout. The website was tested by a test group of customers, and an old website was presented to a control group. The table below shows the percentage of users in each group who made purchases on the websites: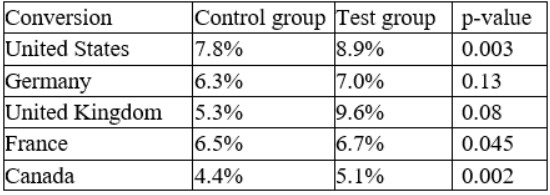
Which of the following conclusions is accurate at a 95% confidence interval?
Correct Answer:
A
The p-value is a measure of how likely it is to observe a difference in conversion rates as large or larger than the one observed, assuming that there is no difference between the groups. A common threshold for statistical significance is 0.05, meaning that there is a 5% or less chance of observing such a difference by chance alone. The table shows the p-values for each country, and we can see that only Germany has a p- value above 0.05 (0.13). This means that we cannot reject the null hypothesis that there is no difference in conversion rates between the test and control groups in Germany. Therefore, the increase in conversion from the new layout was not significant in Germany. For the other countries, the p-values are below 0.05, indicating that the increase in conversion from the new layout was statistically significant. Option A is correct.
Option B is incorrect because the increase in conversion from the new layout was
significant in France (p-value = 0.002).
Option C is incorrect because it does not account for the variation across countries. While the overall conversion rate for the test group (8.4%) is higher than the control group (6.8%), this difference may not be statistically significant when we consider the country-specific effects.
Option D is incorrect because the new layout has the highest conversion rate in the United Kingdom (9.6%), not the lowest.
References:
✑ P-value Calculator & Statistical Significance Calculator
✑ p-value Calculator | Formula | Interpretation
✑ How to obtain the P value from a confidence interval | The BMJ
✑ Confidence Intervals & P-values for Percent Change / Relative Difference
An analyst has generated a report that includes the number of months in the first two quarters of 2019 when sales exceeded $50,000: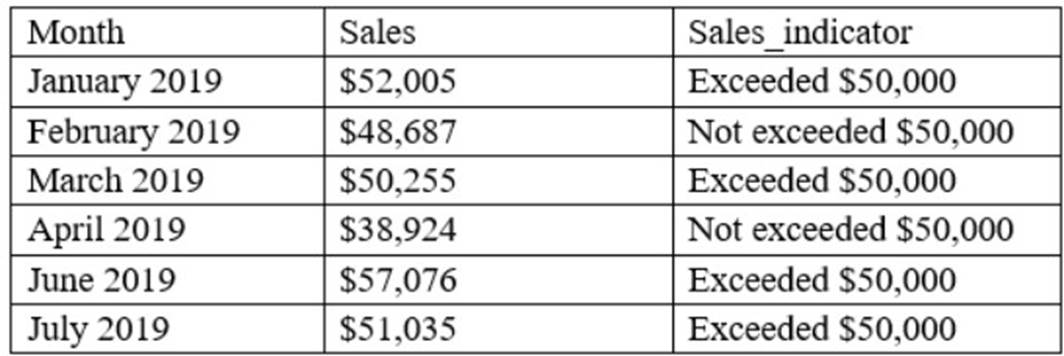
Which of the following functions did the analyst use to generate the data in the Sales_indicator column?
Correct Answer:
B
This is because a logical function is a type of function that returns a value based on a condition or a set of conditions. A logical function can be used to generate the data in the Sales_indicator column by comparing the values in the Sales column with a threshold of $50,000 and returning either ??Exceeded $50,000?? or ??Not exceeded $50,000?? accordingly. For example, a logical function in Excel that can achieve this is:
The other functions are not suitable for generating the data in the Sales_indicator column. Here is why:
Aggregate is a type of function that performs a calculation on a group of values, such as sum, average, count, etc. An aggregate function cannot generate the data in the Sales_indicator column because it does not compare the values in the Sales column with a threshold or return a text value based on a condition.
Date is a type of function that manipulates or extracts information from dates, such as year, month, day, etc. A date function cannot generate the data in the Sales_indicator column because it does not use the values in the Sales column or return a text value based on a condition.
Sort is a type of function that arranges the values in a column or a range in ascending or descending order. A sort function cannot generate the data in the Sales_indicator column because it does not create a new column or return a text value based on a condition.
A data analyst is creating a report that will provide information about various regions, products, and time periods. Which of the following formats would be the most efficient way to deliver this report?
Correct Answer:
D
The best format to deliver this report is D. A dashboard with filters at the top that the user can toggle.
A dashboard is a visual display of the most important information needed to achieve one or more objectives, consolidated and arranged on a single screen so the information can be monitored at a glance1 A dashboard with filters at the top that the user can toggle would allow the user to easily and quickly access the information they need about various regions, products, and time periods, without having to navigate through multiple tabs, pages, or emails. A dashboard with filters would also enable the user to compare and contrast different views of the data and see how they change over time. A dashboard with filters would also be more interactive and engaging than a static or email report2
A workbook with multiple tabs for each region would not be an efficient way to deliver this report, because it would require the user to switch between different tabs to see the information they need. This would make it harder to compare and contrast different regions, products, and time periods, and also increase the risk of errors or confusion. A workbook with multiple tabs would also be less visually appealing and more cluttered than a dashboard3
A daily email with snapshots of regional summaries would not be an efficient way to deliver this report, because it would limit the user??s ability to explore the data in depth and customize their view. A daily email would also be dependent on the frequency and timing of the email delivery, which might not match the user??s needs or preferences. A daily email
would also be more likely to be ignored or deleted than a dashboard that is always accessible.
A static report with a different page for every filtered view would not be an efficient way to deliver this report, because it would create a very long and cumbersome report that would be difficult to read and understand. A static report would also not allow the user to change or update the filters as they wish, or see how the data changes over time. A static report would also be less interactive and engaging than a dashboard.
A junior web developer is developing a new application where users can upload short videos. The first task is to create a homepage that shows the headline "Upload Your Short Videos" and a clickable button that says "upload now".
Which of the following HTML commands would help the developer to complete the task successfully?
Correct Answer:
C tag defines a paragraph of text. The
The HTML commands that would help the developer to complete the task successfully areUpload Your Short Videos
and <button>upload now</button>. The tag defines a heading level 1, which is the largest and most important heading on a webpage. The <button> tag defines a clickable button that can perform some action when clicked. The other options are not suitable for the task, as they either use the wrong tags or do not create a clickable button. The tag defines a section of text with no specific meaning or formatting. The
