A stakeholder wants to see daily sales targets organized in a dashboard by country, state, city, and ZIP Code. Which of the following delivery considerations must a data analyst take into account when creating the dashboard?
Correct Answer:
B
An analyst is working with the income data of suburban families in the United States. The data set has a lot of outliers, and the analyst needs to provide a measure that represents the typical income. Which of the following would BEST fulfill the analyst??s goal?
Correct Answer:
A
his is because median is a type of statistical measure that represents the typical value or central tendency of a data set, which means that it divides the data set into two equal halves, such that half of the values are above it and half are below it. Median can be used to provide a measure that represents the typical income of suburban families in the United States, especially when the data set has a lot of outliers, which means that it has values that are unusually high or low compared to the rest of the data set. Median can provide a measure that represents the typical income of suburban families in the United States, because it is not affected or skewed by the outliers, as it only depends on the middle value or the middle two values of the data set, regardless of how extreme or distant the outliers are. For example, median can provide a measure that represents the typical income of suburban families in the United States, by finding the income value that splits the data set into two equal groups of families, such that 50% of the families have higher incomes and 50% have lower incomes. The other statistical measures are not the best measures to represent the typical income of suburban families in the United States. Here is why:
✑ Mean is a type of statistical measure that represents the average value or central tendency of a data set, which means that it is the sum of all the values divided by the number of values. Mean is not a good measure to represent the typical income of suburban families in the United States, especially when the data set has a lot of outliers, because it is affected or skewed by the outliers, as it takes into account all the values in the data set, regardless of how extreme or distant they are. For example, mean can provide a measure that does not represent the typical income of suburban families in the United States, by finding the income value that is influenced by a few very high or very low incomes, which could make it higher or lower than most of the incomes in the data set.
✑ Mode is a type of statistical measure that represents the most frequent value or
mode of a data set, which means that it is the value that occurs most often in the data set. Mode is not a good measure to represent the typical income of suburban families in the United States, especially when the data set has a lot of outliers, because it is not representative or indicative of the central tendency or distribution of the data set, as it only depends on the count or occurrence of a single value or a few values in the data set, regardless of how common or rare they are. For example, mode can provide a measure that does not represent the typical income of suburban families in the United States, by finding the income value that is repeated more often than others, which could be an outlier or an anomaly in the data set.
✑ Standard deviation is a type of statistical measure that represents the amount of
dispersion or variation of a data set, which means that it quantifies how much the values in a data set vary or deviate from the mean or average of the data set.
Standard deviation is not a measure that represents the typical income of suburban families in the United States, but rather a measure that describes the spread or distribution of their incomes, as well as identifies any outliers or extreme values in their incomes. For example, standard deviation can provide a measure that describes how diverse or homogeneous their incomes are, as well as how far their incomes are from their average income.
A site reliability team wants to monitor the stability of their website. so they can proactively diagnose issues when they occur Which of the following deliverables would best suit their needs?
Correct Answer:
A
The best deliverable that would suit the site reliability team??s needs is A. A self-serve dashboard of website performance that updates in real time.
A self-serve dashboard is a visual display of the most important information needed to achieve one or more objectives, consolidated and arranged on a single screen so the information can be monitored at a glance. A self-serve dashboard of website performance that updates in real time would allow the site reliability team to easily and quickly access the information they need about the stability of their website, such as uptime, response time, error rate, traffic volume, etc. A self-serve dashboard would also enable the team to proactively diagnose issues when they occur, by providing alerts, notifications, or drill-down options. A self-serve dashboard would also be more interactive and engaging than a report or an email.
A weekly log report of site visits and user actions would not be a good deliverable for the site reliability team??s needs, because it would not provide timely or relevant information about the stability of their website. A weekly log report would be too infrequent and delayed to monitor and diagnose issues when they occur. A weekly log report would also focus on the behavior and actions of the users, rather than the performance and functionality of the website.
A portal that is refreshed daily and reports errors classified by type would not be a good deliverable for the site reliability team??s needs, because it would not provide real-time or comprehensive information about the stability of their website. A portal that is refreshed daily would be too slow and outdated to monitor and diagnose issues when they occur. A portal that reports errors classified by type would be too narrow and limited to capture the full picture of the website performance.
A daily summary email indicating website outages for the previous day would not be a good deliverable for the site reliability team??s needs, because it would not provide real-time or actionable information about the stability of their website. A daily summary email would be too late and retrospective to monitor and diagnose issues when they occur. A daily summary email indicating website outages would also be too passive and generic to help the team resolve or prevent issues in the future.
Which of the following data types must be used when working with variables that require classification into two or more groups before analysis?
Correct Answer:
D
An analyst is designing a dashboard that will provide a story of the sales and sales customer ratio. The following data is available: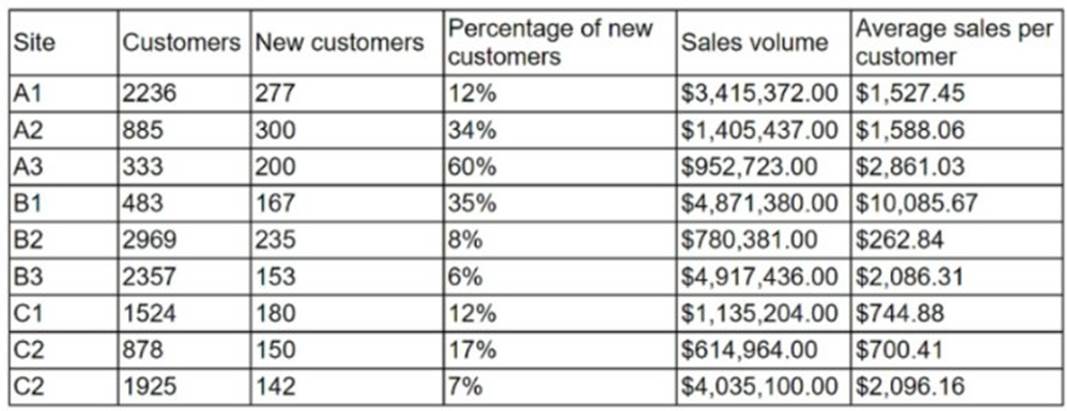
Which of the following charts should the analyst consider including in the dashboard?
Correct Answer:
A
For a dashboard that aims to tell a story about sales and the sales customer ratio, a column chart is an effective choice. Column charts are particularly useful for showing data changes over a period of time or for illustrating comparisons among items. In this case, a column chart can clearly display the sales figures for each site, allowing for easy comparison across different sites. Additionally, it can be used to represent the sales customer ratio by showing the proportion of sales per customer, which can provide insights into customer behavior and sales effectiveness.
✑ Line charts are best suited for displaying data trends over time, rather than for comparing individual categories.
✑ Pie charts could show the proportion of sales for each site, but they are not as effective as column charts for comparing multiple categories.
✑ Scatter charts are used to show the relationship between two variables, which is not the focus in this scenario.
References:
✑ Effective Use of Column Charts1
✑ Choosing the Right Chart for Your Data2
✑ Sales Dashboards: Examples & Templates3
