A recurring event is being stored in two databases that are housed in different geographical locations. A data analyst notices the event is being logged three hours earlier in one database than in the other database. Which of the following is the MOST likely cause of the issue?
Correct Answer:
C
The most likely cause of the issue is that the databases are recording the event in different time zones. A time zone is a region that observes a uniform standard time for legal, commercial, and social purposes. Different time zones have different offsets from Coordinated Universal Time (UTC), which is the primary time standard by which the world regulates clocks and time. For example, UTC-5 is five hours behind UTC, while UTC+3 is three hours ahead of UTC. If an event is being stored in two databases that are housed in different geographical locations with different time zones, it may appear that the event is being logged at different times, depending on how the databases handle the time zone conversion. For example, if one database records the event in UTC-5 and another database records the event in UTC+3, then an event that occurs at 12:00 PM in UTC-5 will appear as 9:00 AM in UTC+3. The other options are not likely causes of the issue, as they are either unrelated or implausible. The data analyst is not querying the databases incorrectly, as this would not affect the time stamps of the events. The databases are not
recording different events, as they are supposed to record the same recurring event. The second database is not logging incorrectly, as there is no evidence or reason to assume that. Reference: [Time zone - Wikipedia]
Which of the following is the first step an analyst should perform upon receiving a business request for analysis?
Correct Answer:
C
Answer C. Review the business questions to understand the scope.
The first step an analyst should perform upon receiving a business request for analysis is to review the business questions to understand the scope of the problem, the objectives, and the expected outcomes. This will help the analyst to define the analytical approach, identify the data needs and sources, and plan the analysis process. Reviewing the business questions will also help the analyst to communicate with the stakeholders and clarify any assumptions or ambiguities1.
Option A is incorrect, as determining the data needs and sources for analysis is not the first step, but rather a subsequent step that depends on the business questions and the analytical approach.
Option B is incorrect, as initiating the analysis for exploratory data analysis is not the first step, but rather a part of the analysis process that involves examining and summarizing the data, identifying patterns and outliers, and testing hypotheses.
Option D is incorrect, as finalizing the methodology to solve the problem is not the first step, but rather a later step that involves selecting and applying the appropriate analytical techniques, tools, and models to answer the business questions.
During data profiling, an analyst decides to recode the status column in the following data set: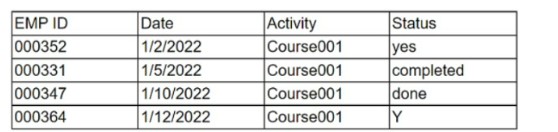
Which of the following data concerns explains why the analyst wants to take this action?
Correct Answer:
D
The ??Status?? column in the dataset shows different terms such as ??yes??, ??completed??, ??done??, and ??Y?? that likely represent the same outcome - that a task has been completed. This variation in terms leads to inconsistency within the data. Data profiling aims to ensure that data is consistent, among other quality metrics, to facilitate accurate analysis and reporting. By recoding the ??Status?? column, the analyst seeks to address this inconsistency, ensuring that all entries indicating completion are represented uniformly. This enhances the data quality and usability for subsequent data analysis tasks.References:
The action of recoding is taken to standardize the data entries and eliminate inconsistencies, which is crucial for maintaining data integrity and ensuring reliable data analysis.
Which of the following best describes a business analytics tool with interactive visualization and business capabilities and an interface that is simple enough for end users to create their own reports and dashboards?
Correct Answer:
C
The best answer is C. Microsoft Power BI.
Microsoft Power BI is a business analytics and business intelligence service by Microsoft. It aims to provide interactive visualizations and business intelligence capabilities with an interface simple enough for end users to create their own reports and dashboards. Power BI can connect to multiple data sources, clean and transform data, create custom calculations, and visualize data through charts, graphs, and tables. Power BI can be accessed through a web browser, mobile device, or desktop application and integrated with other Microsoft tools like Excel and SharePoint12
Python is not correct, because Python is a general-purpose programming language that can be used for various applications, including data analysis and visualization. However, Python is not a dedicated business analytics tool, and it requires coding or programming skills to create reports and dashboards.
R is not correct, because R is a programming language and software environment for statistical computing and graphics. R can be used for data analysis and visualization, but it is not a specialized business analytics tool, and it requires coding or programming skills to create reports and dashboards.
SAS is not correct, because SAS is a software suite for advanced analytics, business intelligence, data management, and predictive analytics. SAS can provide interactive visualizations and business capabilities, but it does not have an interface that is simple enough for end users to create their own reports and dashboards. SAS also requires coding or programming skills to use its features.
A data analyst wants to create "Income Categories" that would be calculated based on the existing variable "Income". The "Income Categories" would be as follows:
Income category 1: less than $1.
Income category 2: more than $1 and less than $20,000. Income category 3: more than $20,001 and less than $40,000. Income category 4: more than $40,001.
Which of the following data manipulation techniques should the data analyst use to create "Income Categories"?
Correct Answer:
B
The correct answer is B: Derived variables Derived variables are variables that you create by calculating or categorizing variables that already exist in your data set.
Data merge is incorrect. Data merging is the process of combining two or more data sets into a single data set. Data blending is incorrect.
Data blending involves pulling data from different sources and creating a single, unique, dataset for visualization and analysis.
Data append is incorrect. A data append is a process that involves adding new data elements to an existing database.
