Which of the following tools would be best to use to calculate the interquartile range, median, mean, and standard deviation of a column in a table that has 5.000.000 rows?
Correct Answer:
B
You would like to measure how well an organization is achieving its goals. What type of analysis should you perform?
Correct Answer:
A
Performance analysis is the technique of studying or comparing the performance of a specific situation in contrast to the aim and yet executed. In Human Resources, performance analysis can help to review an employee's contribution towards a project or assignment, which they allotted him or her.
An organization would like to add a secondary email field to its customer database in order
to enrich the customer profiles. Which of the following data manipulation techniques should the analyst use to add this information?
Correct Answer:
C
A data analyst was asked to create a chart that shows the relationship between study hours and exam scores for each student using the data sets in the table below: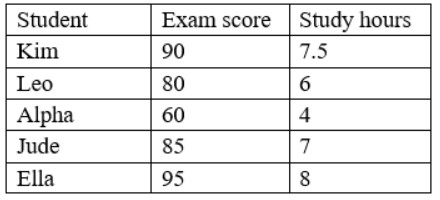
Which of the following charts would BEST represent the relationship between the variables?
Correct Answer:
B
This is because a scatter plot is a type of chart that shows the relationship between two variables for each observation or unit in a data set, such as study hours and exam scores for each student in this case. A scatter plot can be used to display and analyze the correlation, trend, or pattern among the variables, as well as identify any outliers or clusters in the data. For example, a scatter plot can show if there is a positive, negative, or no correlation between study hours and exam scores, as well as show if there are any students who have unusually high or low exam scores compared to their study hours. The other charts are not the best charts to represent the relationship between the variables. Here is why:
✑ A histogram is a type of chart that shows the frequency or the count of values in a single variable for different intervals or bins, such as exam scores for different ranges in this case. A histogram can be used to display and analyze the distribution, shape, or spread of the variable, as well as identify any gaps, peaks, or skewness in the data. For example, a histogram can show if most students have high, low, or average exam scores, as well as show if there are any intervals that have no students at all.
✑ A heat map is a type of chart that shows the intensity or the magnitude of values in two variables for different categories or groups, such as exam scores and study hours for different student names in this case. A heat map can be used to display and analyze the variation, contrast, or comparison among the categories or groups, as well as identify any hot spots, cold spots, or gradients in the data. For example, a heat map can show which students have higher or lower exam scores and study hours than others, as well as show if there is a color pattern that indicates a relationship between exam scores and study hours.
✑ A bar chart is a type of chart that shows the value or the amount of a single variable for different categories or groups, such as exam scores for different student names in this case. A bar chart can be used to display and analyze the comparison, ranking, or proportion among the categories or groups, as well as identify any differences, similarities, or outliers in the data. For example, a bar chart can show which students have higher or lower exam scores than others, as well as show if there are any students who have exceptionally high or low exam scores.
Which of the following will MOST likely be streamed live?
Correct Answer:
A
Machine data is the most likely type of data to be streamed live, as it refers to data generated by machines or devices, such as sensors, web servers, network devices, etc. Machine data is often produced continuously and in large volumes, requiring real-time processing and analysis. Other types of data, such as key-value pairs, delimited rows, and flat files, are more likely to be stored in databases or files and processed in batches.
