A data analyst is creating a report that will provide information about various regions, products, and time periods. Which of the following formats would be the most efficient way to deliver this report?
Correct Answer:
D
The best format to deliver this report is D. A dashboard with filters at the top that the user can toggle.
A dashboard is a visual display of the most important information needed to achieve one or more objectives, consolidated and arranged on a single screen so the information can be monitored at a glance1 A dashboard with filters at the top that the user can toggle would allow the user to easily and quickly access the information they need about various regions, products, and time periods, without having to navigate through multiple tabs, pages, or emails. A dashboard with filters would also enable the user to compare and contrast different views of the data and see how they change over time. A dashboard with filters would also be more interactive and engaging than a static or email report2
A workbook with multiple tabs for each region would not be an efficient way to deliver this report, because it would require the user to switch between different tabs to see the information they need. This would make it harder to compare and contrast different regions, products, and time periods, and also increase the risk of errors or confusion. A workbook with multiple tabs would also be less visually appealing and more cluttered than a dashboard3
A daily email with snapshots of regional summaries would not be an efficient way to deliver this report, because it would limit the user??s ability to explore the data in depth and customize their view. A daily email would also be dependent on the frequency and timing of the email delivery, which might not match the user??s needs or preferences. A daily email
would also be more likely to be ignored or deleted than a dashboard that is always accessible.
A static report with a different page for every filtered view would not be an efficient way to deliver this report, because it would create a very long and cumbersome report that would be difficult to read and understand. A static report would also not allow the user to change or update the filters as they wish, or see how the data changes over time. A static report would also be less interactive and engaging than a dashboard.
Which of the following types of analysis is used when comparing last week's sales to the previous week's sales?
Correct Answer:
A
A database administrator needs to ensure only approved users can access specific database tables to perform financial functions. Which of the following is the best access control method for the administrator to use?
Correct Answer:
A
A data analyst is compiling a report that a Chief Executive Officer needs for an impromptu meeting. The report should include information on the previous day's performance. Which of the following reports should the analyst provide?
Correct Answer:
B
An analyst modified a data set that had a number of issues. Given the original and modified versions: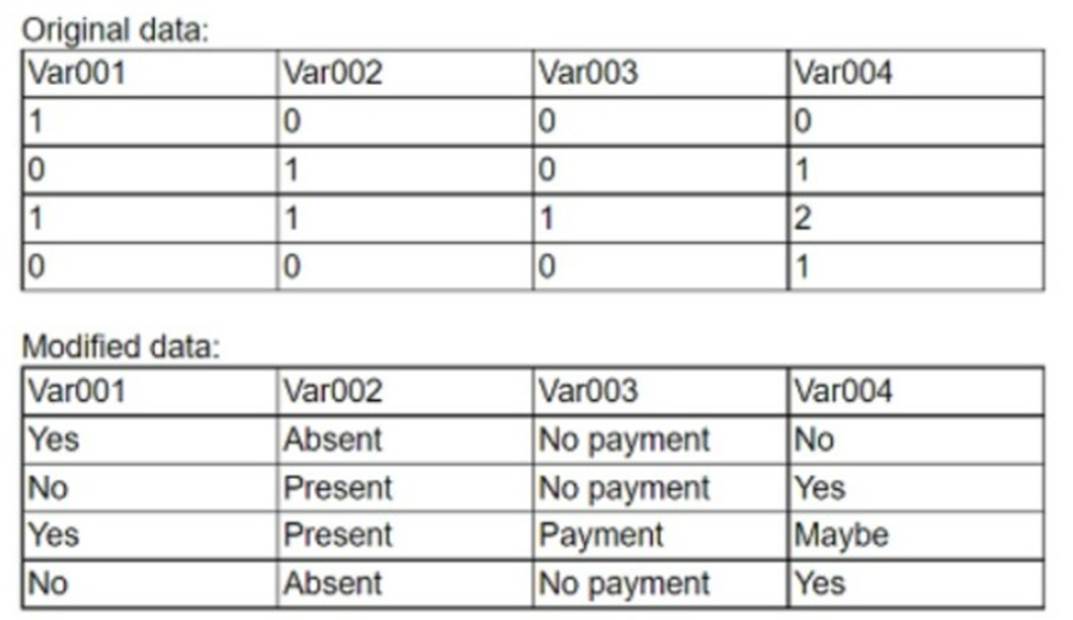
Which of the following data manipulation techniques did the analyst use?
Correct Answer:
B
The correct answer is B. Recoding.
Recoding is a data manipulation technique that involves changing the values or categories of a variable to make it more suitable for analysis. Recoding can be used to simplify or group the data, to correct errors or inconsistencies, or to create new variables from existing ones12
In the example, the analyst used recoding to change the values of Var001, Var002, Var003, and Var004 from numerical to textual form. The analyst also used recoding to assign meaningful labels to the values, such as ??Absent?? for 0, ??Present?? for 1, ??Low?? for 2, ??Medium?? for 3, and ??High?? for 4. This makes the data more understandable and easier to analyze.
