A data analyst has been asked to create a daily manufacturing report for the floor manager Which of the following metrics should be included in the report?
Correct Answer:
A
An analyst has been tracking company intranet usage and has been asked to create a chat to show the most-used/most-clicked portions of a homepage that contains more than 30 links. Which of the following visualizations would BEST illustrate this information?
Correct Answer:
B
This is because a heat map is a visualization that uses colors to represent different values or intensities of a variable. A heat map can be used to show the most- used/most-clicked portions of a homepage that contains more than 30 links by assigning different colors to each link based on how frequently they are clicked by the users. For example, a link that is clicked very often can be colored red, while a link that is clicked rarely can be colored blue. A heat map can help the analyst to identify which links are more popular or important than others on the homepage. The other visualizations are not as effective as a heat map for this purpose. Here is why:
A scatter plot is a visualization that uses dots or points to represent the relationship between two variables. A scatter plot cannot show the most-used/most-clicked portions of a homepage that contain more than 30 links because it does not have a clear way of mapping each link to a point on the graph.
A pie chart is a visualization that uses slices or sectors to represent the proportion of each category in a whole. A pie chart cannot show the most-used/most-clicked portions of a homepage that contains more than 30 links because it does not have enough space to display all the categories clearly and accurately.
An infographic is a visualization that uses images, icons, charts, and text to convey information or tell a story. An infographic cannot show the most-used/most-clicked portions of a homepage that contain more than 30 links because it does not have a consistent or standardized way of representing each link and its click frequency.
Exhibit.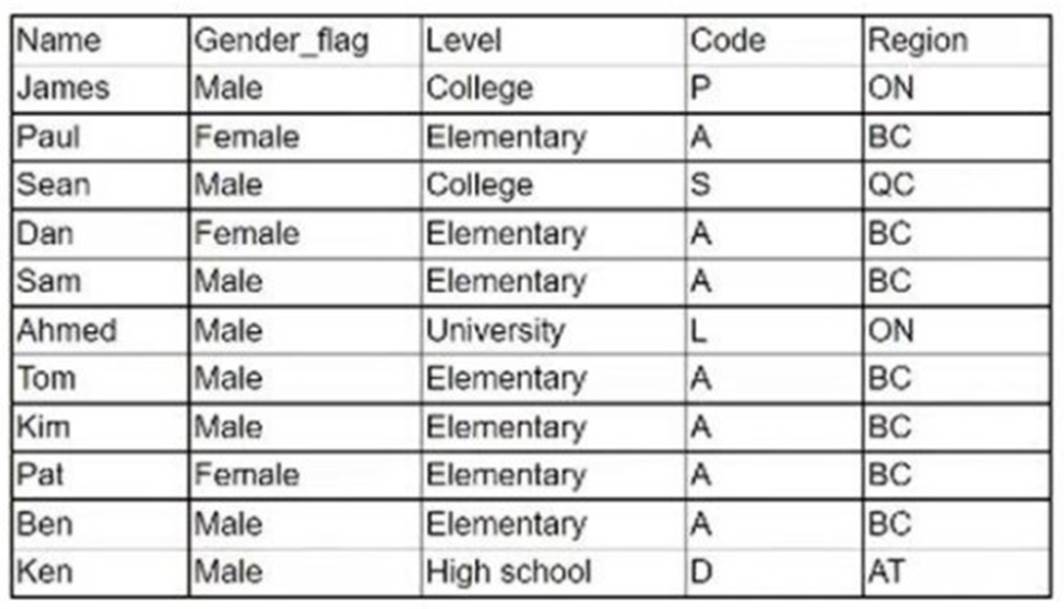
Which of the following logical statements results in Table B?
A)
B)
C)
D)
Correct Answer:
D
The logical statement that results in Table B is Option D. Option D is a logical statement that uses the AND operator to combine two conditions: Name = ??Tom?? and Region = ??BC??. The AND operator returns true only if both conditions are true, otherwise it returns false. Therefore, Option D will select only the rows from Table A that satisfy both conditions, which are rows 4, 5, 6, and 7. These rows form Table B, as shown below: Name | Gender flag | Level | College | Code | Region Tom | Male | Elementary | A | BC | BC Kim | Female | Elementary | A | BC | BC Pat | Female | Elementary | A | BC | BC Ben | Male
| Elementary | A | BC | BC
The other options are not correct, as they use different logical operators or conditions that do not result in Table B. Option A uses the OR operator, which returns true if either condition is true, or both. Option A will select all the rows from Table A except row 3, which does not match either condition. Option B uses the NOT operator, which returns the opposite of the condition. Option B will select all the rows from Table A except rows 4, 5, 6, and 7, which match the condition. Option C uses a different condition, Region = ??ON??, which does not match any row in Table A. Option C will select no rows from Table A. Reference: [SQL Logical Operators - W3Schools]
An analyst has written the following code: SELECT *
FROM Cust_table
WHERE age > 60 AND City = "New York"
Which of the following criteria is the analyst retrieving?
Correct Answer:
C
The SQL query provided is selecting all records from the Cust_table where the age column has values greater than 60 and the City column matches ??New York??. The > operator selects values that are strictly greater than the comparison value, so it does not include customers aged exactly 60. The term ??New York?? in the context of a city database typically refers to New York City, not the state of New York. Therefore, the correct answer is that the analyst is retrieving data for all customers older than age 60 in New York City.
References:
✑ The use of the > operator in SQL is to select values greater than the specified value1.
✑ Understanding the WHERE clause in SQL and its use in filtering records based on specified conditions2.
✑ Clarification on the distinction between city and state names in database records3.
A database consists of one fact table that is composed of multiple dimensions. Each dimension is represented by a denormalized table. This structure is an example of a:
Correct Answer:
D
A star schema is a type of database schema that consists of one fact table and multiple dimension tables. The fact table contains the measures or metrics of the business process, such as sales, orders, or transactions. The dimension tables contain the attributes or characteristics of the business entities, such as products, customers, or locations. The fact table is connected to the dimension tables by foreign keys that reference the primary keys of the dimension tables. The fact table is located at the center of the schema, while the dimension tables are located at the edges, forming a star-like shape1.
A star schema is an example of a denormalized schema, which means that the dimension tables are not normalized and may contain redundant or repeated data. This is done to improve the performance and simplicity of queries, as there are fewer joins and tables involved. A star schema is suitable for data warehouses and business intelligence applications that require fast and efficient data retrieval2.
