- (Topic 2)
DIAGRAM TAKEN
A data scientist is analyzing a dataset to determine if there is a strong relationship between twovariables. A measure of covariance is done. Which of the following graphs indicate Zero Covariance between variables?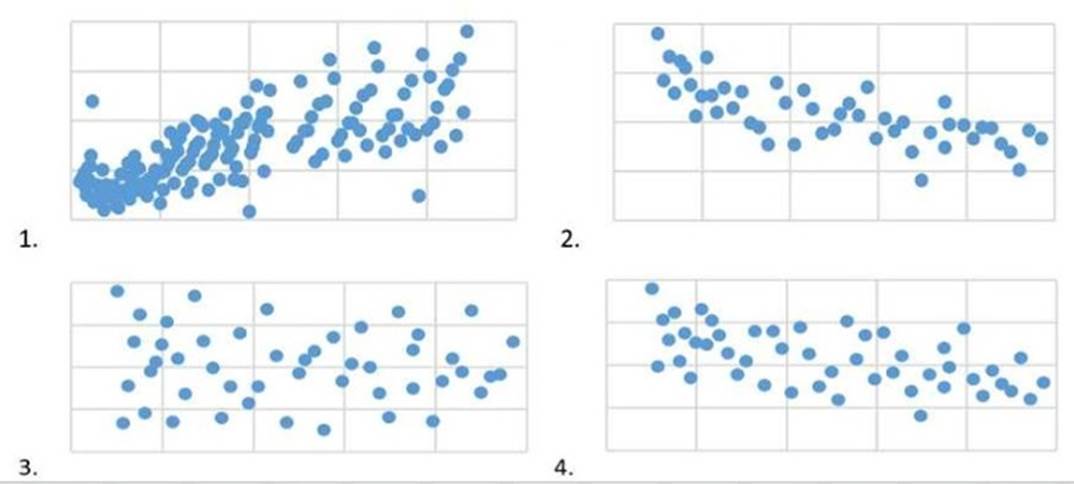
Correct Answer:
C
In the context of Business Data Analytics (IIBA®- CBDA), zero covariance between two variables indicates that there is no linear relationship between those variables. When the covariance is zero, it means the variables are independent of each other. In the provided options, graph 4 shows a random scatter of data points without any apparent trend or pattern, indicating zero covariance.
References: The explanation is in alignment with the concepts and principles outlined in IIBA??s resources on Business Data Analytics, particularly focusing on statistical analysis and data interpretation.
- (Topic 2)
DIAGRAM
The following boxplot is produced from a dataset. From this boxplot which of the following conclusions can be drawn?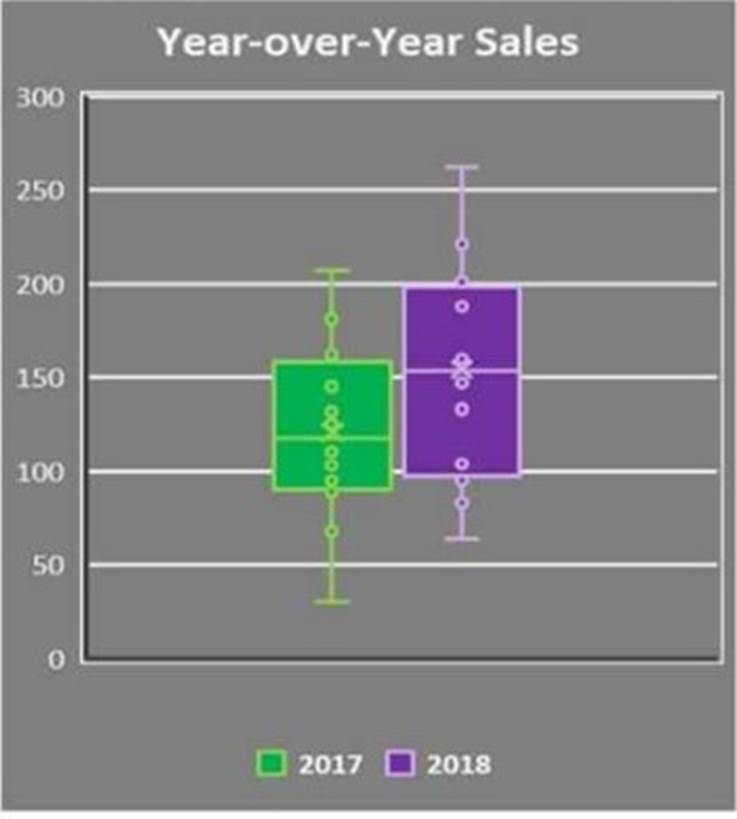
Year-over-Year Sales
300
200
Correct Answer:
B
According to the Guide to Business Data Analytics, a boxplot is used to provide a visual summary of one or more groups of data values through their quartiles. In this case, the boxplot shows two different years, 2017 and 2018, with distinct medians and interquartile ranges. The median is represented by the line inside the box, while the interquartile range is represented by the height of the box itself. Outliers are marked with circles above and below the box. From the boxplot, we can see that the median sales for
2018 are higher than the median sales for 2017, and the interquartile range for 2018 is narrower than the interquartile range for 2017. This means that the sales for 2018 are more concentrated around the median and have less variability than the sales for 2017. Therefore, the correct answer is B.
References: Guide to Business Data Analytics, page 58-59; CBDA Exam Blueprint, page 7; [Introduction to Business Data Analytics: A Practitioner View], page 17.
![Year-over-Year Sales]
- (Topic 2)
What is the relationship between a Customer entity and an Order entity, where a customer entry will be present in the Customer entity regardless of whether an order was made?
Correct Answer:
C
A zero-to-many relationship between two entities means that one instance of the first entity can be associated with zero or more instances of the second entity, and one instance of the second entity can be associated with only one instance of the first entity1. In this case, a customer entry will be present in the Customer entity regardless of whether an order was made, which means that a customer can have zero or more orders, but an order can only belong to one customer. Therefore, the relationship between Customer and Order is zero-to-many.
References:1: Entity Relationship Diagram (ERD) Tutorial - Part 1
- (Topic 2)
There were 7 students enrolled in the Introduction to Artificial Intelligence course. The scores from the final exam were as follows: 64, 70. 80, 80, 90, 98, 100
What is the mean and median for the outlined scores?
Correct Answer:
B
The mean of a set of numbers is the sum of the numbers divided by the number of numbers. The median of a set of numbers is the middle value when the numbers are arranged in ascending or descending order. To find the mean and median of the given scores, we can use the following steps:
✑ To find the mean, we add up all the scores and divide by 7, the number of
students. The mean is (64 + 70 + 80 + 80 + 90 + 98 + 100) / 7 = 582 / 7 = 83.14
✑ To find the median, we arrange the scores in ascending order: 64, 70, 80, 80, 90, 98, 100. Since there are an odd number of scores, the median is the middle score, which is 80.
Therefore, the mean and median for the outlined scores are 83.14 and 80, respectively. References: Guide to Business Data Analytics, page 54; CBDA Exam Blueprint, page 7; [Introduction to Business Data Analytics: A Practitioner View], page 16.
- (Topic 1)
While creating a dataset for analysis, the analyst reviews the data collected and finds a large percentage of records are missing values. Which activity would the analyst perform in order to use this dataset?
Correct Answer:
C
Weighting is a technique that assigns different values or weights to different records or variables in a dataset, based on their importance or relevance. Weighting can be used to handle missing values by giving them a lower weight or imputing them with a weighted average of other values. Weighting can also help to adjust for sampling bias or non- response bias in the data collection process. References:
•Understanding the Guide to Business Data Analytics, page 16
•Business Analysis Certification in Data Analytics, CBDA | IIBA®, CBDA Competencies, Domain 3: Analyze Data
•CERTIFICATION IN BUSINESS DATA ANALYTICS HANDBOOK - IIBA®, page 8, CBDA Exam Sample Questions and Self-Assessment, Question 4
